In distributed systems, the gap between a minor glitch and a major outage often hinges on the observability stack. Teams must evaluate monitoring tools that balance tracing precision, alert management, cost efficiency, and interoperability. This article explores observability and monitoring tools through four critical dimensions: distributed tracing accuracy and sampling trade-offs, alert noise and on-call burden, pricing models for high-cardinality data, and OpenTelemetry compatibility and vendor lock-in.
Distributed Tracing Accuracy and Sampling Trade-offs
Distributed tracing is essential for modern observability, enabling teams to track requests across multiple services. However, recording every trace is often impractical due to cost and performance overhead. Sampling—selecting a subset of traces to record—introduces trade-offs between accuracy and resource consumption. The two main strategies are head-based and tail-based sampling.
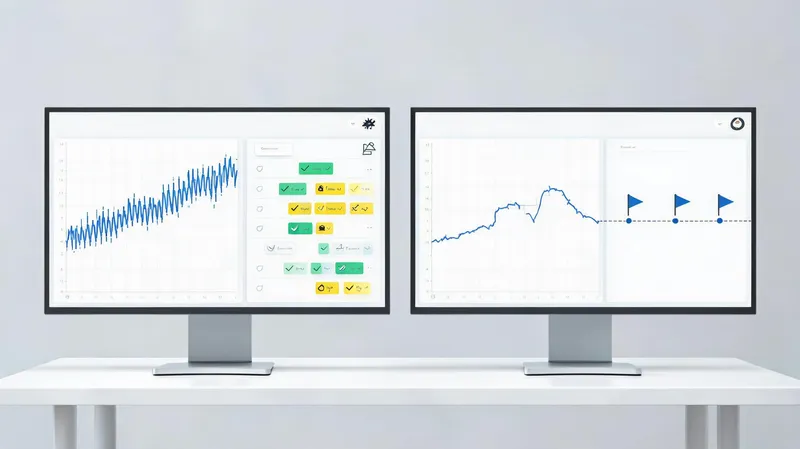
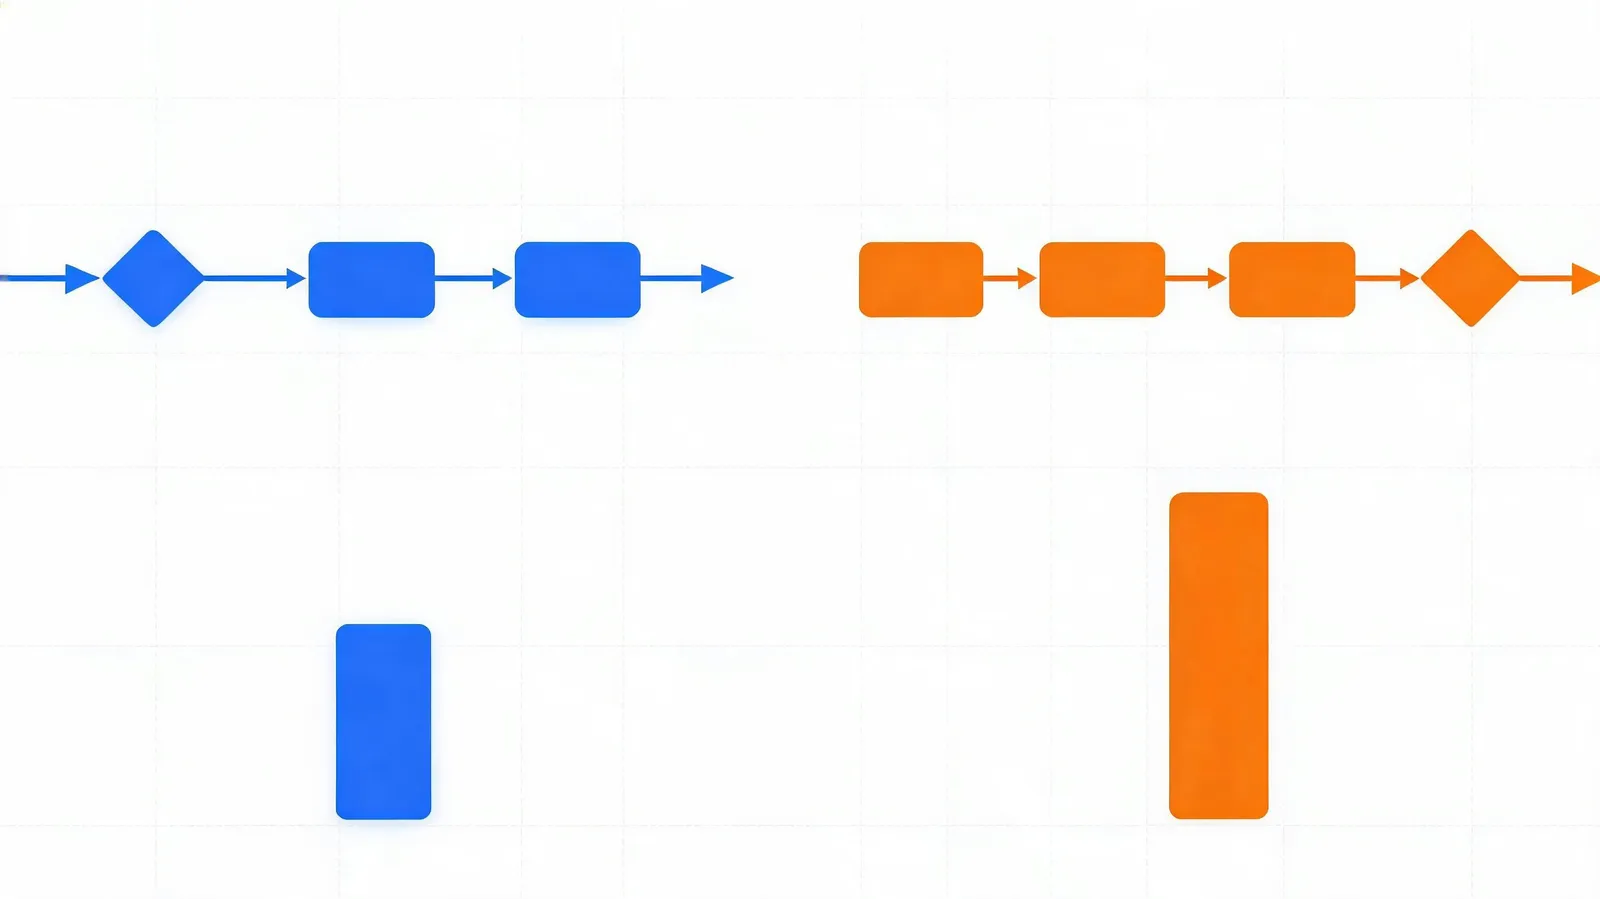
Head-based sampling decides at the start of a trace, typically at the root service. It is simple and low-overhead but may miss critical errors that occur later. Tail-based sampling waits until the trace is complete, allowing capture of all traces with errors or high latency. This improves accuracy but requires buffering and more complex infrastructure.
A 2024 case study of a financial services company reported a 70% reduction in false negatives after switching from head-based to tail-based sampling. This underscores the importance of flexible sampling configurations. When evaluating observability and monitoring tool reviews, consider how each platform handles sampling:
- Jaeger: Supports both head-based and tail-based sampling via the OpenTelemetry Collector. Tail-based sampling requires a separate collector deployment.
- Grafana Tempo: Primarily head-based, but can integrate with the OpenTelemetry Collector for tail-based sampling. It is designed for cost-effective trace storage.
- Datadog: Offers proprietary head-based sampling and an optional tail-based sampling feature (App Analytics) that can be enabled at an additional cost.
- New Relic: Provides head-based sampling by default, with tail-based sampling available through its Infinite Tracing feature, which uses a dedicated edge network.
Benchmark data from a 2025 study indicates that tail-based sampling can increase trace ingestion costs by 20-30% but reduces mean time to detection (MTTD) by up to 50%. The key is to align sampling strategy with reliability goals and budget.
Alert Noise, On-Call Burden, and Incident Response
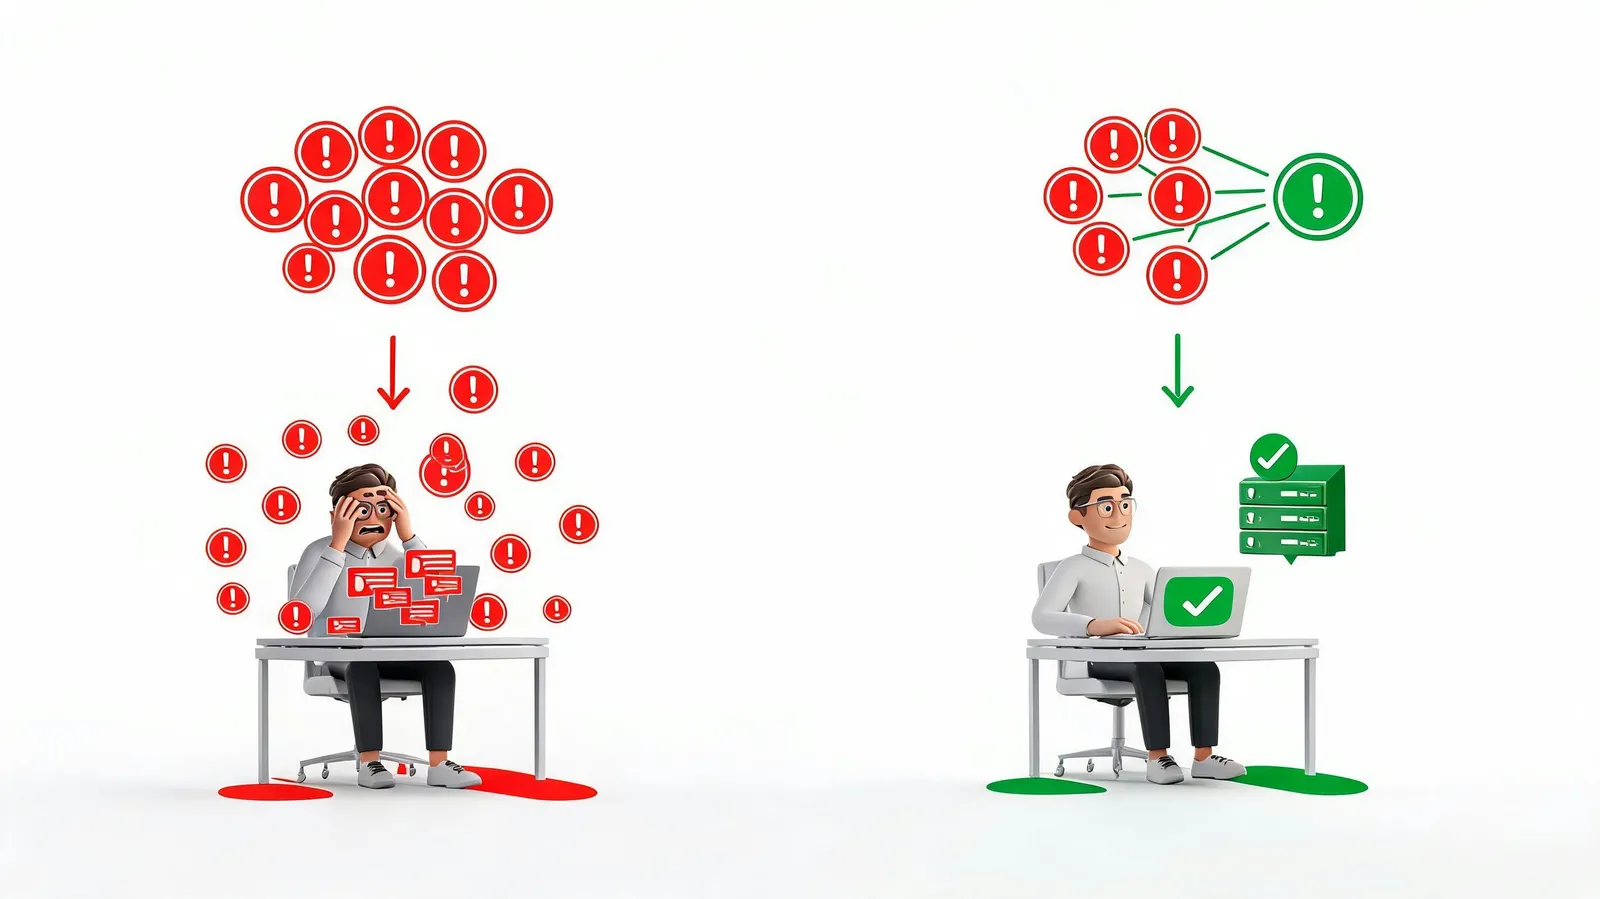
Alert fatigue silently erodes on-call productivity. When teams face hundreds of alerts, critical incidents can get lost. Observability tools aim to reduce noise through alert correlation, deduplication, and intelligent grouping. A 2024 survey found that teams using alert correlation features reduced mean time to acknowledge (MTTA) by 35% on average.
Tools like Grafana OnCall, PagerDuty, and Opsgenie offer built-in noise reduction. Grafana OnCall, for instance, groups alerts by service and severity, and can automatically resolve alerts when the underlying issue is fixed. PagerDuty uses machine learning to group related alerts into a single incident, while Opsgenie provides deduplication and suppression rules.
Integration with incident management and runbook automation is equally important. Native integrations with Slack, Microsoft Teams, and Jira streamline communication. Webhook support allows custom workflows. A case study from a SaaS company showed that automating runbooks for common issues reduced on-call escalations by 40% and cut resolution time in half.
When reviewing observability and monitoring tools, assess how well they integrate with your existing incident response processes. Look for features like:
- Alert correlation across multiple data sources
- Automated runbook execution
- Two-way sync with incident management platforms
- Customizable escalation policies
Pricing Models for High-Cardinality Data
High-cardinality data—such as user IDs, request IDs, or IP addresses—can explode storage and query costs. Cardinality refers to the number of unique combinations of metric labels. For example, a metric with a user_id label can have millions of unique values, each requiring separate storage and indexing. This can lead to unpredictable bills and forced trade-offs between granularity and cost.
Observability vendors use various pricing models to address this. Common models include per-host, per-metric, per-seat, and usage-based pricing. Usage-based pricing, often based on data ingested or indexed, is the most common for high-cardinality data but can be the most volatile.
A comparison of monthly costs for a sample workload (100 hosts, 1 million active series, 1 TB of logs) across four vendors reveals significant differences:
| Vendor | Pricing Model | Estimated Monthly Cost | Cost-Control Features |
|---|---|---|---|
| Datadog | Per host + custom metrics + log ingestion | $12,000 | Adaptive sampling, custom metric filtering, retention policies |
| New Relic | Per GB ingested + per user | $8,500 | Data plus pricing, infinite tracing, cardinality limits |
| Grafana Cloud | Per metric series + log volume + traces | $6,200 | Adaptive metrics, usage caps, free tier |
| Elastic | Per resource unit (based on RAM/CPU) | $9,000 | Index lifecycle management, rollups, frozen tier |
Cost optimization features like adaptive sampling, retention policies, and custom metrics filtering can help control costs. For instance, Datadog’s adaptive sampling automatically adjusts trace sampling based on traffic patterns, while Grafana Cloud offers usage caps to prevent bill shock. When evaluating observability and monitoring tool reviews, pay close attention to how each vendor handles high-cardinality data and what tools they provide to manage costs.
OpenTelemetry Compatibility and Vendor Lock-In
OpenTelemetry (OTel) has emerged as the de facto standard for instrumenting applications, providing a vendor-neutral way to collect traces, metrics, and logs. However, not all observability tools support OTel equally. Some rely on proprietary agents, which can lead to vendor lock-in and make migration painful.
A 2025 matrix of OTel support across major vendors shows varying levels of maturity:
- Jaeger: Native OTel support for traces; metrics and logs via OTel Collector.
- Prometheus: Native OTel support for metrics; traces via OTel Collector.
- Datadog: Supports OTel for traces and metrics, but logs require its proprietary agent for full functionality.
- New Relic: Full OTel support for traces, metrics, and logs, with a native OTLP endpoint.
- Grafana Cloud: Full OTel support via the OTel Collector, with native OTLP endpoints for all signals.
Vendor lock-in is a real risk when proprietary agents are used. A case study of a team migrating from a proprietary agent to OTel highlights the challenges: they had to rewrite instrumentation code and retrain staff, but ultimately gained flexibility and reduced costs by 30%. Best practices to avoid lock-in include using OTel collectors, adhering to standard semantic conventions, and choosing vendors that support OTLP natively.
Strategies to ensure portability:
- Instrument with OTel SDKs from the start.
- Use the OTel Collector as a gateway to decouple instrumentation from backends.
- Standardize on semantic conventions for resource attributes.
- Regularly export data to a secondary backend to test portability.
Teams that successfully switched vendors with minimal disruption reported that using OTel collectors and standard conventions was key. As the industry moves toward OTel standardization, choosing a vendor with strong OTel support is a future-proof decision.
Conclusion
Selecting the right observability and monitoring tool requires balancing tracing accuracy, alert management, cost, and interoperability. There is no one-size-fits-all solution; the best tool depends on your team’s specific pain points and scale. For teams struggling with missed errors, tail-based sampling may be worth the investment. For those drowning in alerts, prioritize tools with robust correlation and automation. For cost-sensitive organizations, evaluate pricing models carefully and leverage cost-control features. And for those wary of lock-in, demand native OpenTelemetry support.
Looking ahead, the trend toward OpenTelemetry standardization and AI-driven observability will continue. Tools that embrace open standards and intelligent automation will be best positioned to help teams navigate the complexities of modern distributed systems. By focusing on these four dimensions, you can future-proof your observability stack and ensure reliable, cost-effective operations.